Most marketing teams celebrate a surge in clicks or impressions, only to struggle when it’s time to tie those metrics to revenue. If your team has experienced something similar, you’re not alone. Almost 20% of marketing teams say that one of the biggest challenges they face is employing a data-driven strategy. Measuring the true success of a marketing campaign in a way that leads directly to business results is one of the most persistent issues teams are up against.
Here, you’ll learn a practical, outcome-first approach to define what success really means for your business, which KPIs you should focus on, and track ROI without getting lost in the weeds. By the end, you’ll come away with a repeatable method to measure the metrics that move the needle.
What Does Success Really Mean for Your Team?
Before diving into the tactical details of your marketing campaign, take a step back and ask: what does success actually look like for our business? For some companies, it might be driving a certain amount of revenue growth. For others, the primary goal could be improving customer retention or achieving greater cost efficiency. The key is to clarify your most important business outcome first because everything else should support that overarching objective.
Write your campaign’s top-line outcome as a single sentence before launch. If it’s longer than one line, it’s not clear enough. For example:
- “Increase new customer revenue by 15%”
- “Improve customer retention by 10%”
- “Reduce customer acquisition cost by 20%”
Forcing yourself to boil success down to one straightforward goal ensures everyone on your team understands what you’re really aiming for, not just the surface-level stuff, but the big-picture result that matters to your business.
Which KPIs Prove Business Impact?
Once you’ve clarified your campaign’s primary objective, the next step is to identify the key performance indicators (KPIs) that will prove you’re making progress toward that goal. The operative word here is “prove.” We want metrics that directly demonstrate real business results, not just hint at them.
Select no more than two primary KPIs that tie closest to your core outcome. Why the hard limit? Because when everything is important, nothing is. Tracking too many KPIs inevitably leads to diffused focus and conflicting priorities.
Example
Let’s say your main goal is to increase revenue. Your primary KPIs might be new revenue generated and average order value. Anything else, like email open rates or social media shares, should be considered secondary. These are nice to track, but not the ultimate measures of success.
To choose the right primary KPIs, let your specific campaign goal be the guide:
- Revenue growth goals: new revenue, average order value, margin per order, lifetime value (LTV)
- Acquisition efficiency goals: customer acquisition cost (CAC), pipeline-to-close rate, payback period
- Retention goals: repeat purchase rate, churn, expansion revenue, LTV/CAC
By centering a small set of KPIs that reflect your true business priorities, you’ll keep your team oriented toward outcomes, not just activity.
How Should Supporting Metrics Roll Up?
Your primary KPIs tell you whether you’re winning or losing. Supporting metrics tell you why and what to adjust. The key is to organize these secondary indicators into a clear hierarchy that connects tactical activity to business outcomes.
Think of it as a three-tier structure:
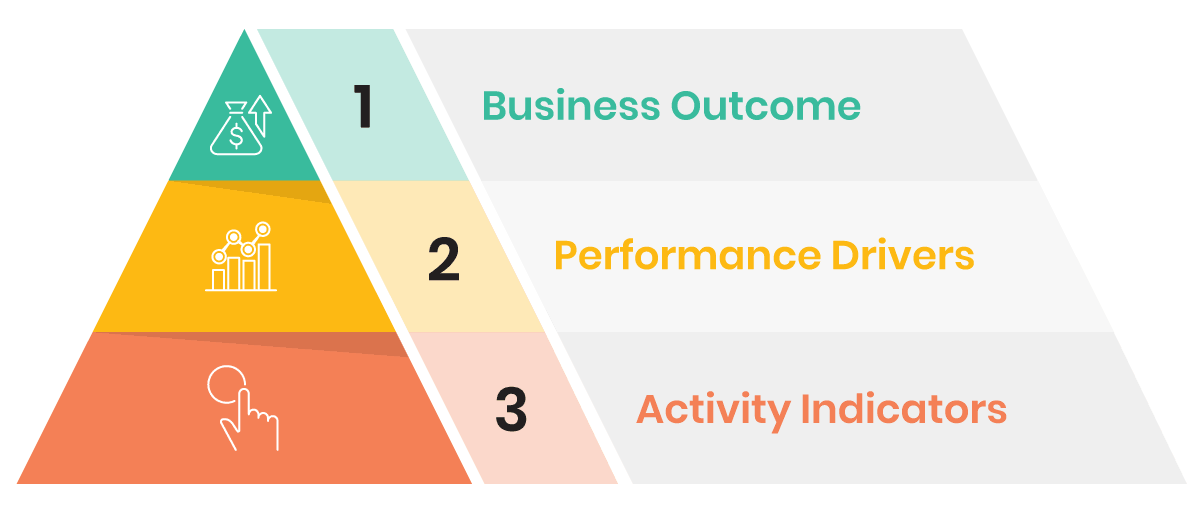
- Tier 1 (Business Outcome): Your one or two primary KPIs—revenue, retention, or efficiency metrics that directly reflect your campaign goal.
- Tier 2 (Performance Drivers): The metrics that directly influence your primary KPIs, such as conversion rate, average order value, or lead quality score.
- Tier 3 (Activity Indicators): Tactical metrics like email open rates, click-through rates, or impressions that signal engagement but don’t guarantee outcomes.
This hierarchy prevents teams from chasing vanity metrics that look impressive on the surface but don’t translate into meaningful business impact.
Pro Tip
Map every metric you track to one of these three tiers. If a metric doesn’t clearly roll up to a Tier 2 driver or Tier 1 outcome, question whether you need to track it at all.
How to Set Baselines, Targets, and Time Windows
Metrics without context are just numbers. To make informed decisions, you need to know what “good” looks like for your business and how long it takes to get there.
- Start by establishing a baseline: your current performance level before the campaign launches.
This might be your average monthly revenue, typical conversion rate, or standard cost per acquisition. Without a baseline, you can’t measure improvement. - Next, set a realistic target based on your business goal and historical performance.
If your baseline conversion rate is 2%, aiming for 10% overnight is wishful thinking. A 20–30% improvement is ambitious but achievable for most campaigns. - Finally, define your measurement window.
How long will you run the campaign before evaluating results? For most B2B campaigns, a 30- to 90-day window provides enough data to assess performance while accounting for longer sales cycles.
Document these three elements before launch:
- Baseline: Current performance level
- Target: Desired improvement or absolute goal
- Time Window: Duration before evaluation
This framework creates accountability and prevents premature optimization. You’ll know exactly when to scale, fix, or stop a campaign based on objective criteria.
How Do You Track ROI Simply?
Now that you’ve defined your primary KPIs and supporting metrics, it’s time to put systems in place to measure them accurately. The key word here is “simply.” We want reliable ROI data, not a convoluted web of tracking tools that creates more confusion than clarity.
At a minimum, you’ll need:
Consistent UTM tagging on all campaign links
UTM parameters create an auditable trail from first touch to conversion. By consistently tagging your URLs with details like campaign, source, and medium, you can trace the true origin and path of every lead and customer.
Opportunity and revenue data synced from your CRM
Make sure your marketing platform and CRM are speaking the same language. Ideally, leads generated from campaigns should automatically create or update contact records in your CRM, complete with original source data.

Conversion pixels placed on key actions
Use conversion pixels judiciously to track the most important on-site events. Think purchases, demo requests, or pricing page views which are actions that signal high-value intent.
With these fundamentals in place, you can choose a simple marketing attribution model that fits your business. For most SMB teams, that means:
- Last-touch attribution with time decay for longer sales cycles
- First-touch attribution to measure top-of-funnel campaign effectiveness
- A hybrid model that uses first-touch for budget allocation and last-touch for in-flight optimization
Pro Tip
Pick one attribution method and stick to it. Switching mid-campaign corrupts data and invites second-guessing whenever the numbers dip. Get the basics right, choose an attribution rule you can defend, and reserve complexity for when your scale demands it.
What Does “Good” Look Like by Channel?
Not all channels perform the same way—and they shouldn’t. Each has unique strengths, audience behaviors, and conversion timelines. Understanding what “good” looks like by channel helps you set realistic expectations and allocate budget effectively.
Email: What to Measure Now
Email remains one of the highest-ROI channels for B2B marketers, but only when you measure the right things. Focus on:
- Open rate: 15–25% is typical for B2B; below 15% signals list fatigue or poor subject lines.
- Click-to-open rate (CTOR): 10–15% indicates strong content relevance; below 10% means your message isn’t resonating.
- Conversion rate: 2–5% from click to desired action (demo request, download, purchase) is a solid benchmark.
Pro Tip
Don’t obsess over open rates alone, as they’re easily inflated by image-loading quirks. Instead, prioritize CTOR and conversion rate, which reflect genuine engagement and intent.
Paid Social: What to Measure Now
Paid social campaigns excel at awareness and top-of-funnel engagement, but conversion rates are typically lower than search or email. Expect:
- Click-through rate (CTR): 0.5–1.5% on LinkedIn; 1–3% on Facebook for B2B audiences.
- Cost per click (CPC): $5–$15 on LinkedIn; $1–$5 on Facebook, depending on targeting and competition.
- Conversion rate: 1–3% from click to lead capture; 0.5–1% for direct sales conversions.
Pro Tip
Paid social works best as part of a multi-touch strategy. Use it to build awareness and retarget engaged audiences, then rely on email or search to close the deal.
How to Avoid Vanity Metrics and Common Traps
Even with a solid measurement framework, it’s easy to fall into traps that distort your view of campaign performance. Here are the most common pitfalls and how to avoid them.
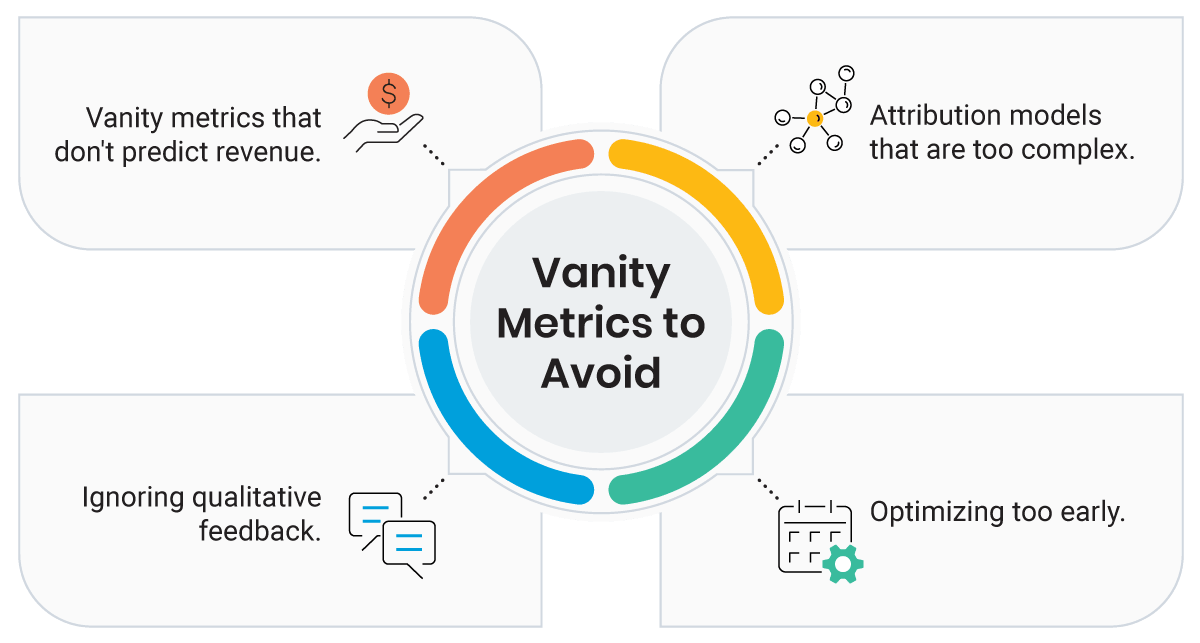
Vanity metrics that don’t predict revenue.
Impressions, page views, and social shares feel good but rarely correlate with business outcomes. If a metric doesn’t connect to a Tier 2 driver or Tier 1 KPI, stop tracking it.
Attribution models that are too complex.
Multi-touch attribution sounds sophisticated, but most SMB teams lack the data volume and sales cycle consistency to make it work. Stick with first-touch, last-touch, or a simple hybrid until your scale demands more.
Optimizing too early.
Resist the urge to tweak campaigns based on a few days of data. Wait for statistical significance—typically 100+ conversions or 30+ days—before making major changes.
Ignoring qualitative feedback.
Numbers tell you what’s happening; conversations tell you why. Regularly review sales call notes, customer surveys, and support tickets to understand the story behind the metrics.
By staying disciplined and avoiding these traps, you’ll build a measurement system that drives smarter decisions.
What Should You Do With These Results?
Measurement without action is pointless. The whole purpose of tracking campaign KPIs is to make better decisions. Ideally, these decisions should lead to improved business outcomes. That means translating your beautifully tracked data into clear, timely actions.
Your optimization playbook should include three potential moves:
- Scale: When a campaign or channel exceeds its target KPIs with stable unit economics (CAC, LTV, margin), increase budget, expand the audience, and ride the wave.
- Fix: If leading indicators like reach and engagement are strong but downstream revenue lags expectations, you likely have a bottleneck to address. Revisit your offer, audience targeting, or conversion flow to unblock the path to purchase.
- Stop: When an initiative falls below baseline performance with no signs of improvement after a reasonable test period, cut your losses and reallocate resources.
Pro Tip
Tie significant budget changes to a simple, objective rule. For example, increase spend by 20% after two consecutive weeks above target, or cut by 50% if performance dips below baseline for two weeks straight.
The goal is steady, incremental improvement, not one-time perfection. Establish clear performance thresholds and allow enough time for statistical significance before making major changes.
Conclusion: Turn Insights Into Your Next Campaign
Measurable marketing success starts with a clear business outcome. It relies on a few carefully chosen KPIs to validate that outcome, using supporting metrics to guide tactical adjustments along the way. Start every campaign by painting a clear picture of success, ruthlessly prune your metrics to the critical few, and treat every initiative as another brick in the foundation of your marketing machine.
When you’re ready to execute campaigns backed by verified data and targeted audiences, try Salesgenie® for the tools to find the right prospects and measure what matters.
FAQs
Write your campaign’s top-line outcome as a single sentence that’s specific and measurable, such as “Increase new customer revenue by 15% this quarter.” This forces clarity and ensures everyone on your team understands the big-picture result that matters to your business, not just surface-level metrics.
Limit yourself to no more than two primary KPIs that directly tie to your core business outcome. When everything is important, nothing is. Tracking too many KPIs leads to diffused focus and conflicting priorities that prevent you from making clear decisions.
You need disciplined UTM tagging on all campaign links, opportunity and revenue data synced from your CRM, and conversion pixels on key actions like purchases or signups. Prioritize consistency over complexity. A simple, well-maintained system beats a brittle, overly complex one.
Scale when campaigns exceed target KPIs with stable unit economics, fix when engagement is strong but revenue lags (indicating a bottleneck), and stop when performance falls below baseline with no improvement after a reasonable test period. Tie budget changes to objective rules, like increasing spend by 20% after two consecutive weeks above target.
Maintain a living “measurement playbook” that your team updates after every major campaign, documenting what worked, what didn’t, and what you’ll change next time. This prevents hard-won insights from evaporating and creates a virtuous cycle of ever-smarter marketing decisions.