
Why Metrics & KPIs Drive Sustainable B2B Growth
Data is your most powerful sales asset if you know what to track. In today’s B2B market, metrics and KPIs form the backbone of predictable revenue by helping sales leaders track what’s working, pinpoint bottlenecks, and course-correct before goals go off-track. From first-touch lead engagement to final contract signature, sales dashboard metrics transform raw activity into actionable insights.
But here’s the challenge: forecasting remains fragile. According to recent research, four in five sales and finance leaders missed at least one quarterly sales forecast last year, and half missed two or more. Without the right data and discipline, even seasoned teams can fly blind.
Learn which B2B sales KPIs matter most, as well as how to apply them to boost your pipeline and forecasting accuracy. Whether you’re refining quarterly forecasts or optimizing rep productivity, you’ll find frameworks to support better decisions and stronger pipelines.
Pro Tip
Track early and you’ll optimize faster. Even basic KPIs, logged consistently, can uncover trends and growth levers faster than intuition alone.
Visit our B2B Sales Guide to learn more about why metrics and KPIs matter.
How to Better Understand B2B Sales Metrics vs. KPIs
Not all sales data is created equal. In B2B sales, metrics are raw measurements. For example, you might track the number of demos booked or total pipeline value. KPIs (Key Performance Indicators) go a step further. They represent strategic targets that align with business goals, such as maintaining a 25% lead-to-opportunity conversion rate or achieving a 3x pipeline coverage ratio.
Think of it this way: metrics tell you what’s happening; KPIs tell you if it’s actually working.
For example, tracking sales activities per rep is useful, but unless you benchmark it against quota attainment or opportunity win rate, it’s just noise. That’s why a strong sales strategy includes both: sales KPIs to track performance and metrics to fine-tune it.
What’s the difference between a KPI and a metric?
A metric is any quantifiable data point. A KPI is a metric tied to a specific, well-defined business goal.
Understanding this distinction helps you build smarter dashboards and measure what truly moves the revenue needle.
Which Core B2B Sales KPIs Should Your Team Monitor?
B2B sales success hinges on the ability to measure what matters and act on it. Whether you’re optimizing rep performance, identifying pipeline bottlenecks, or forecasting revenue, tracking the right sales KPIs and metrics helps you stay aligned with strategic goals.
Below are the essential categories and examples of KPIs that every revenue team should monitor.
Revenue-Focused KPIs
- Monthly/Annual Recurring Revenue (MRR/ARR): Tracks the value of subscriptions or contracts over time. Critical for understanding growth trends and forecasting stability.
- Average Deal Size: Helps evaluate pricing strategy and deal quality across reps, segments, or channels.
- Quota Attainment: Measures how consistently reps meet or exceed targets. It’s one of the most visible sales key performance indicators for leadership.
Pipeline Health KPIs
- Pipeline Coverage Ratio: Compares the value of active opportunities to the quota. A healthy ratio is typically 3–4x the quota, depending on sales cycle length.
- Lead-to-Opportunity Conversion Rate: Reveals the effectiveness of lead qualification and handoff from marketing.
- Opportunity Win Rate: Calculates the percentage of opportunities that result in a closed-won deal. Ideal for tracking team competitiveness and deal progression.
Efficiency KPIs
- Sales Cycle Length: Indicates how long it takes to close a deal, from initial contact to signature. Useful for identifying bottlenecks.
- Customer Acquisition Cost (CAC): Total cost of acquiring a new customer (sales + marketing spend). High CAC may signal inefficiencies or poor targeting.
- Sales Productivity per Rep: Measures revenue generated per rep over a defined period. This is one of the most telling sales productivity metrics.
Pro Tip
Industry benchmarks vary widely by sector and business model, so use them as directional guidance, not absolute targets. Tools like HubSpot, Gartner, and Bridge Group offer fresh benchmark data annually.
By focusing on these key sales performance indicators, B2B teams can turn raw activity into actionable insight and drive measurable growth.
Advanced or Growth-Stage Metrics
Once your sales team has mastered the core KPIs, it’s time to focus on more strategic metrics that reveal long-term value, customer health, and the efficiency of your sales process.
These B2B sales metrics are particularly useful for growth-stage organizations looking to optimize expansion and retention, both of which are key drivers of predictable revenue.
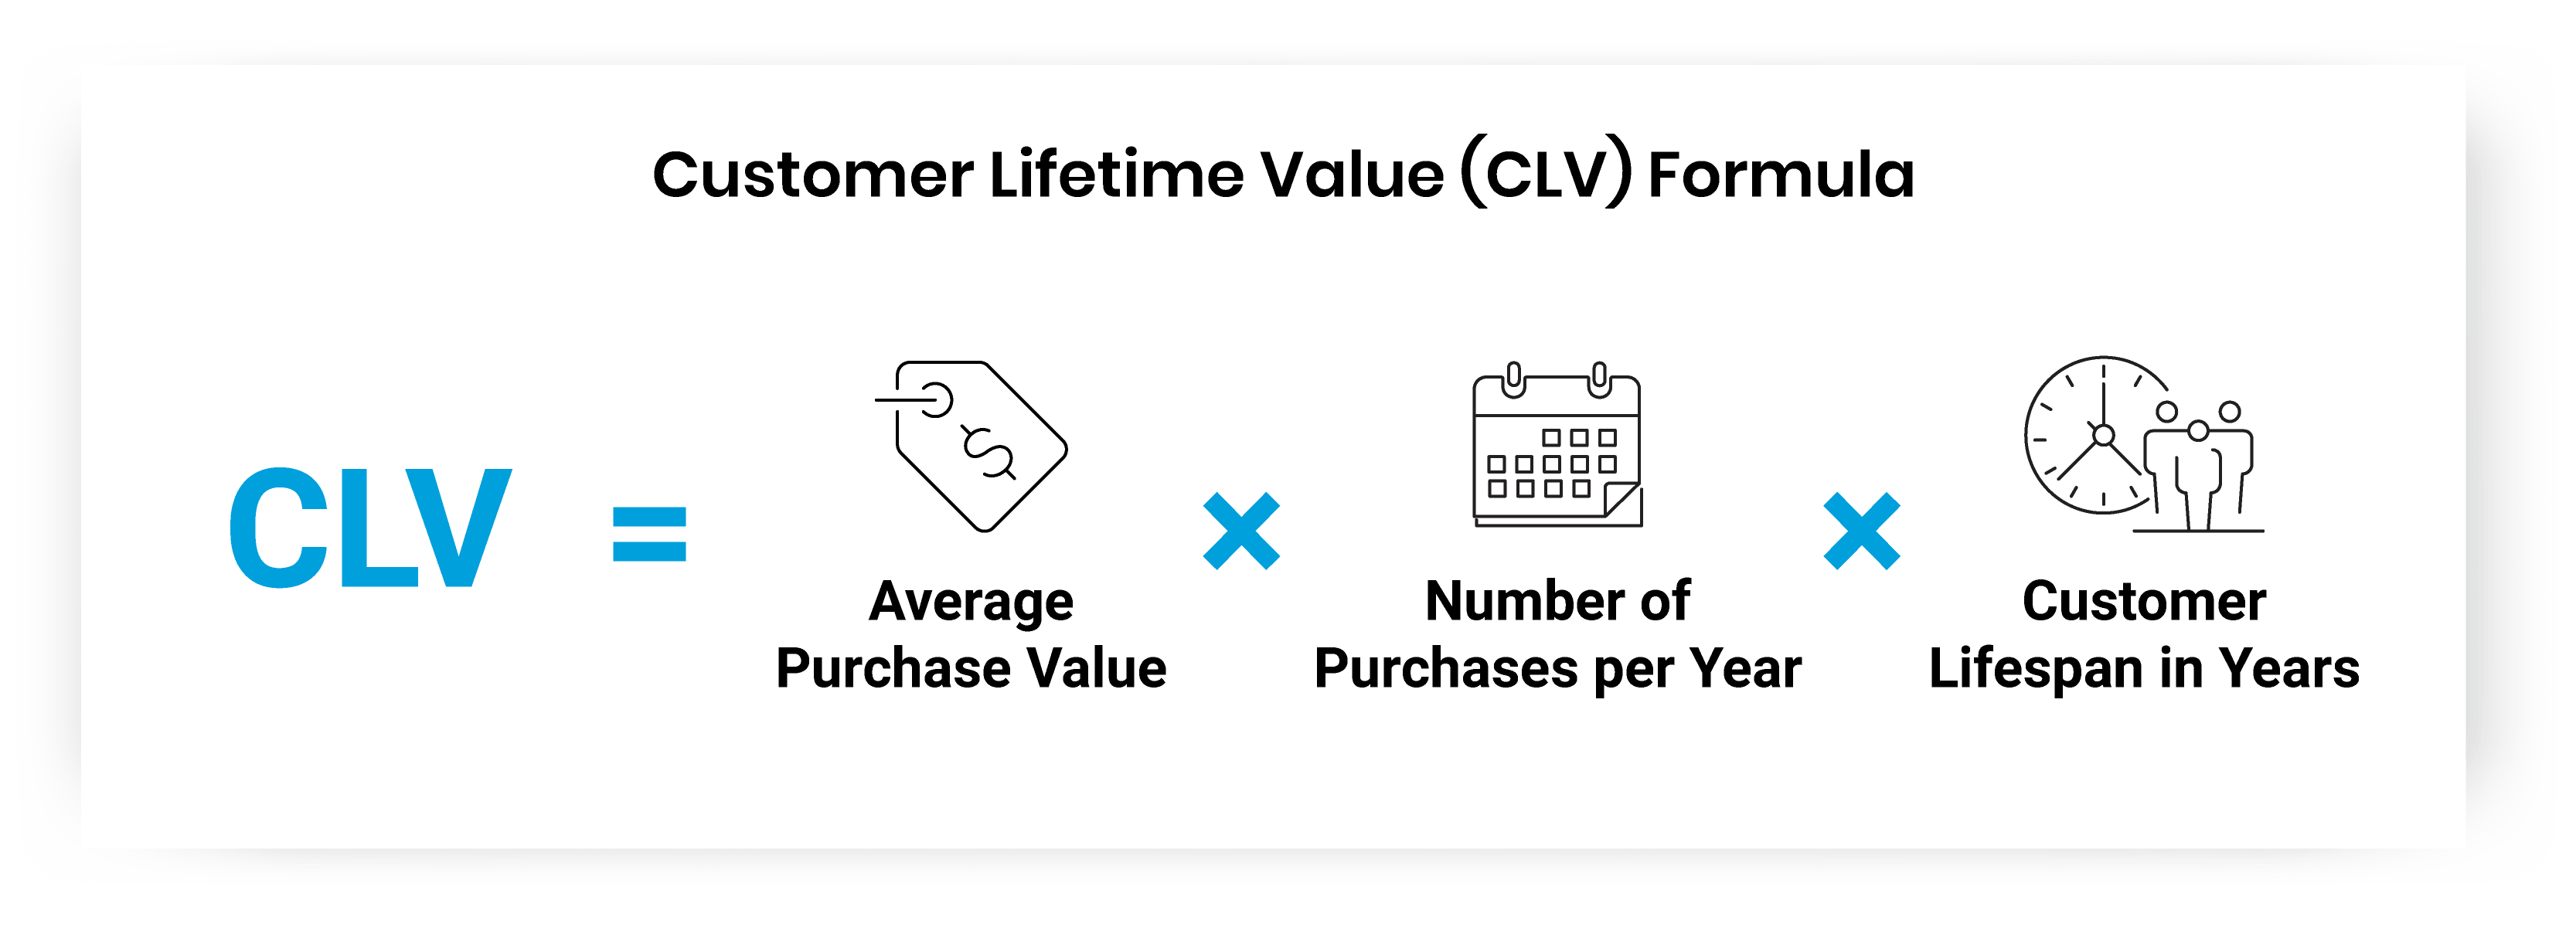
Customer Lifetime Value (CLV)
CLV estimates the total revenue a business can expect from a customer over the course of their relationship. High CLV suggests strong product-market fit and customer loyalty. It guides you toward your most valuable customers and helps you make smarter decisions about follow-up and support.
Net Revenue Retention (NRR)
NRR measures how much revenue you retain from existing customers after accounting for churn, upgrades, and downgrades. A 100%+ NRR indicates sustainable growth without necessarily relying on new customer acquisition.
Expansion/Upsell Rate
This metric tracks the percentage of existing customers who increase their spend over time. It’s a powerful indicator of post-sale value and product adoption. Track it alongside NRR to surface whitespace and expansion opportunities.
Forecast Accuracy
Forecast accuracy compares projected revenue to actual revenue. It reflects both rep judgment and CRM hygiene. Inaccurate forecasts can result in budget shortfalls, excess headcount, or missed opportunities.
Pro Tip
Use a rolling 3-month forecast window for early-stage teams, and narrow to monthly intervals as predictability improves.
Sales Velocity
Sales velocity measures how quickly revenue moves through your pipeline, helping you optimize deal flow and forecasting.
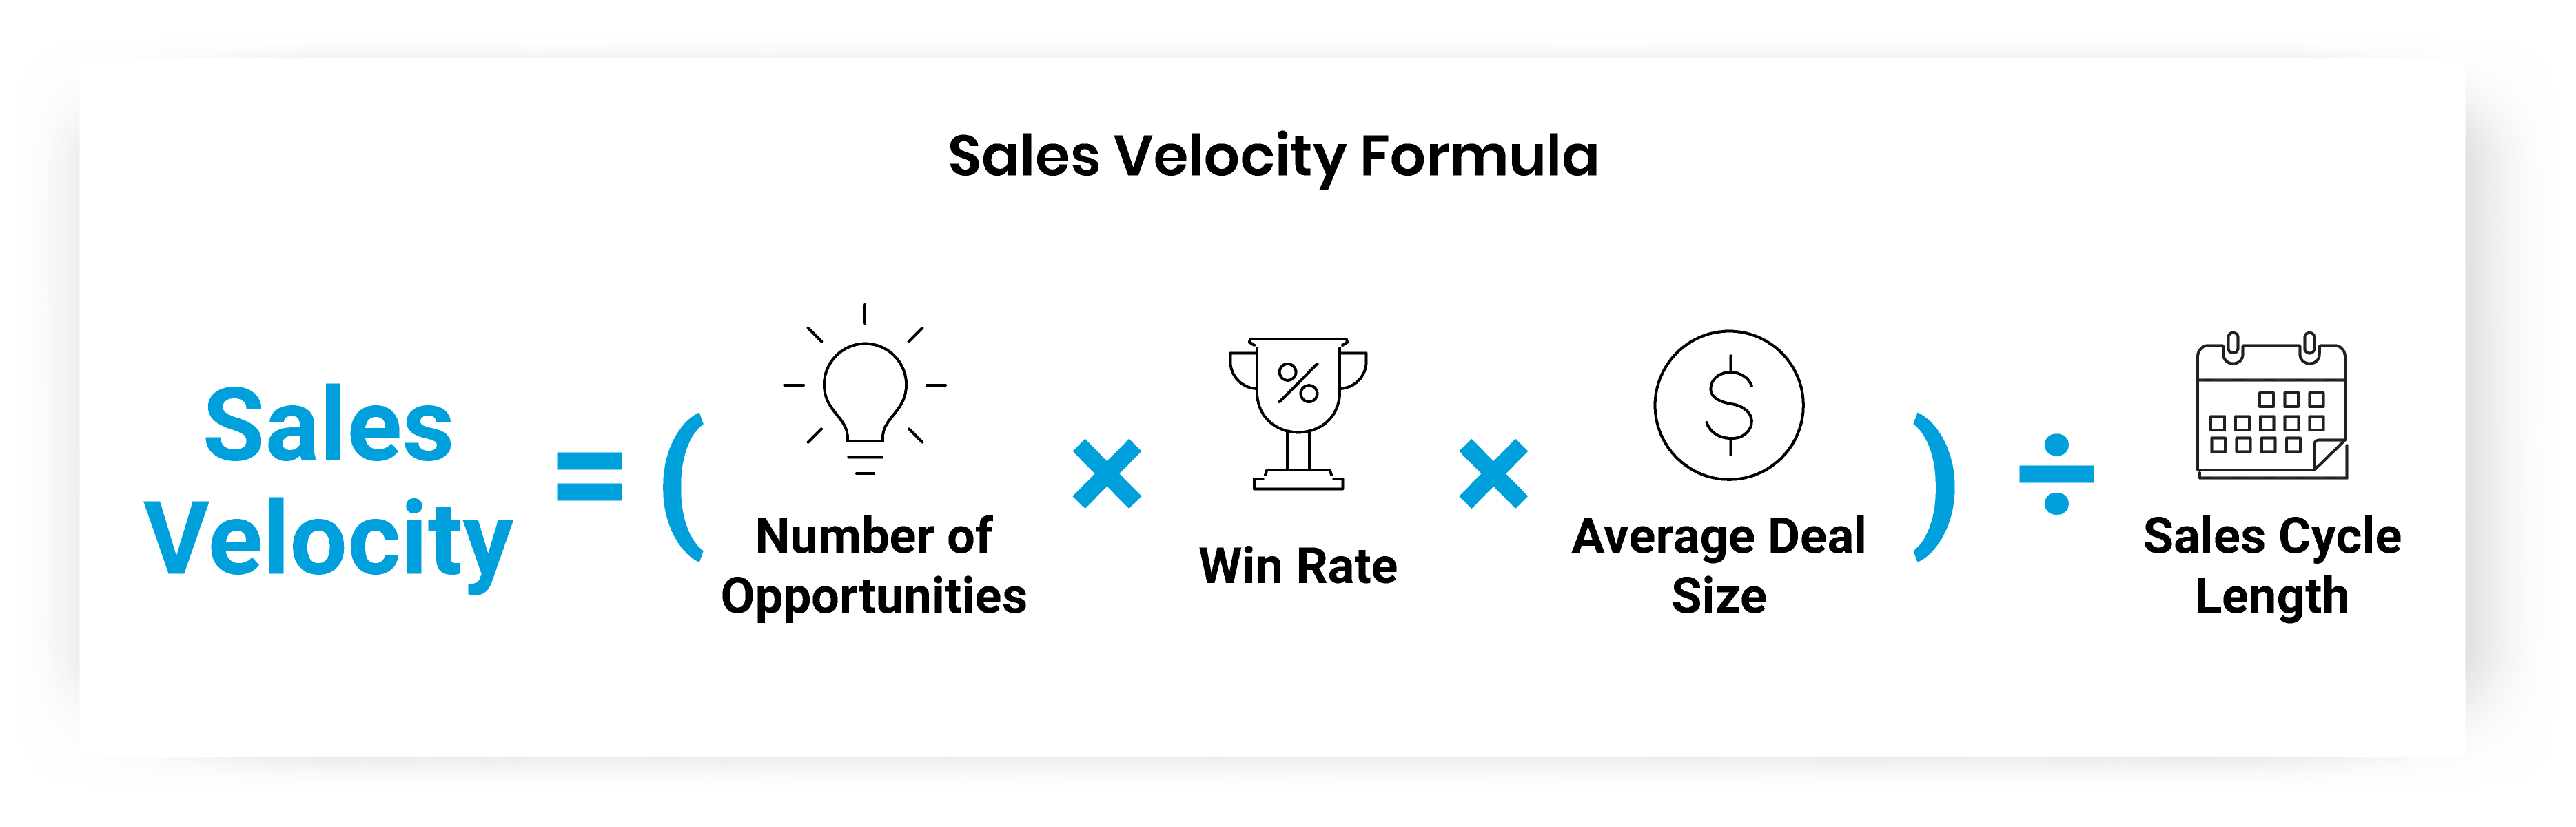
Example: If your team has 40 opportunities, a 25% win rate, a $10K average deal size, and a 30-day cycle, your sales velocity is $3,333/day.
By referring to these sales key performance indicators examples, revenue teams can improve strategic decision-making, accelerate growth, and better allocate resources across the customer lifecycle.
How Can You Align Metrics with the B2B Sales Process?
Sales metrics are most useful when they’re mapped directly to each stage of the buyer’s journey. By aligning sales pipeline metrics with the top, middle, and bottom of the funnel, you can pinpoint where opportunities are stalling and where improvements will have the most revenue impact.
Top-of-Funnel KPIs
At the awareness and interest stages, track:
- Leads Generated: How many new contacts enter your pipeline?
- SQL Rate: What percentage meet qualification criteria?
These KPIs help evaluate the effectiveness of demand generation and lead qualification.
Mid-Funnel KPIs
As buyers move into evaluation, focus on:
- Demo-to-Opportunity Rate: How often do demos or discovery calls convert into qualified opportunities?
- Engagement Score: Are prospects actively engaging with your sales content or reps?
These metrics help diagnose friction in your sales conversations or messaging.
Bottom-Funnel KPIs
To optimize conversion, monitor:
- Close Rate: What percentage of opportunities become closed-won?
- Average Discount: Are reps over-relying on concessions to close deals?
Low close rates or high discounting can signal gaps in objection handling, competitive positioning, or deal qualification.
Pro Tip
Align your key sales performance indicators to the buyer’s journey by tagging each KPI to a funnel stage in your CRM or dashboard. This gives you a stage-by-stage diagnostic view, not just an end-of-quarter surprise.
Tools & Dashboards for Tracking
Tracking KPIs consistently and visualizing them clearly is what separates high-performing sales teams from those flying blind. The right tools transform your data into action, giving every rep, manager, and exec a real-time view of performance.

CRM Analytics: Your KPI Foundation
Salesforce, HubSpot, and Zoho all offer robust analytics capabilities to track sales productivity metrics, monitor pipeline health, and automate reporting. Look for features that support custom dashboards, funnel tracking, and integration with marketing platforms.
BI & Visualization Tools
Pair your CRM with business intelligence (BI) tools like Tableau, Power BI, or Looker to build cross-functional views across marketing, sales, and customer success. These tools help correlate metrics like opportunity aging with churn risk or campaign influence on deal velocity.
Emerging AI & Predictive Tools
AI-powered platforms are now helping sales teams predict which leads will convert, which reps need coaching, and when deals are likely to close. Tools like Clari, People.ai, and Gong leverage real-time data to surface next-best actions and forecasting insights.
Quick Checklist: Must-Have Dashboard Elements
To build a comprehensive dashboard, include these five elements:
- Traffic & Lead Flow: Track inbound leads, lead sources, and qualification rates.
- Pipeline Progression: Visualize stage-to-stage conversion and bottlenecks.
- Rep Productivity: Measure activities per rep, meetings booked, and response rates.
- Revenue Forecasting: Show committed, best-case, and projected revenue.
- Retention & Expansion: Monitor upsells, churn risk, and NRR trends.
Pro Tip
Assign ownership of each dashboard view (marketing ops, sales enablement, revenue ops) to ensure it stays updated and aligned with quarterly goals.
How to Set Targets and Review Performance
Effective goal-setting transforms data into direction. Without realistic benchmarks, even the most well-defined sales KPIs lose impact. To drive focus and accountability, teams should ground their performance reviews in achievable, revenue-aligned targets.
Establishing KPI Benchmarks
Start with historical performance and industry standards to create relevant benchmarks. For instance, if your sales key performance indicators metrics include win rate, pipeline velocity, and quota attainment, evaluate the past 12 months to set attainable yet growth-focused targets. Don’t aim for perfection. Instead, opt for progress you can measure quarter over quarter.
Setting Monthly vs. Quarterly Goals
Monthly goals keep momentum high and surface performance gaps early, while quarterly targets help anchor longer initiatives like expanding average deal size or improving sales cycle length. Align your cadence to your sales cycle; shorter cycles benefit from monthly reviews, while longer enterprise sales benefit from quarterly assessments.
Review Cadence & Accountability
Build a rhythm of performance check-ins. Weekly standups are ideal for discussing lead quality, conversion rates, and rep activities. Monthly reviews can tackle rep productivity and CAC trends. Quarterly Business Reviews (QBRs) are the time to evaluate team-wide KPIs, course correct strategy, and align with broader company goals.
Pro Tip
Visualize key metrics in a shared dashboard before each review. This keeps conversations data-driven, not anecdotal.
Common Pitfalls & How to Avoid Vanity Metrics
Not all metrics are created equal. In the quest to track performance, it’s easy to get distracted by vanity metrics—numbers that look good on paper but don’t meaningfully impact revenue. For B2B sales teams focused on sustainable growth, recognizing and avoiding these misleading indicators is key.
What Are Vanity Metrics?
Vanity metrics are stats that suggest momentum but fail to tie back to tangible business outcomes. Think: raw email opens without understanding reply quality, social post impressions without engagement, or lead volume without conversion data. These figures may inflate dashboards but rarely inform strategic decisions.
Refocus on Value-Driven KPIs
Instead of superficial metrics, prioritize those tied to pipeline movement and revenue. For example, rather than just counting demo bookings, track demo-to-opportunity conversion rate. Replace “click-through rate” with post-click engagement. Strong examples of KPIs in sales include opportunity win rate, customer acquisition cost (CAC), and sales productivity per rep, each a direct signal of go-to-market effectiveness.
Guardrails to Stay on Track
- Define outcome-based KPIs aligned with funnel stages.
- Segment dashboards by persona (e.g., rep, manager, exec) to avoid clutter.
- Contextualize your data—a spike in traffic isn’t a win if time-on-page drops.
- Review quarterly which metrics are driving strategy vs. which are just reporting noise.
Key Takeaways & Action Plan
Tracking the right B2B sales KPIs is one of the highest-leverage moves for driving consistent growth, improving rep performance, and enabling smarter forecasting. Here’s a summary of what matters most—and how to take action quickly.
Key Takeaways
- Not all metrics are KPIs. KPIs are strategic signals aligned to business goals, while metrics are supporting data points. Know the difference to focus your efforts.
- Core sales KPIs include quota attainment, average deal size, lead-to-opportunity conversion rate, opportunity win rate, and sales productivity per rep.
- Growth-stage teams should add metrics like customer lifetime value (CLV), net revenue retention (NRR), and forecast accuracy to fine-tune revenue expansion and forecasting models.
- Sales KPIs tied to pipeline health, such as pipeline coverage ratio and sales velocity, help leadership spot gaps early and course correct.
- Dashboards and tooling matter: Align CRM, BI, and AI tools to provide visibility across traffic, pipeline, revenue, and retention metrics.
Learn more: How to Build a Winning Sales Strategy
30-Day Action Plan
Week 1: Audit
- Inventory all metrics currently tracked by your sales and marketing teams.
- Flag vanity metrics that don’t tie directly to revenue or pipeline health.
- Identify key funnel stages missing strong KPIs.
Week 2: Align
- Map core KPIs to each stage of your B2B sales process.
- Validate metrics against existing systems (CRM, BI, etc.).
- Define owners and cadence for reviewing each metric.
Week 3: Test
- Set short-term benchmarks and track performance.
- Build 1–2 reports or dashboards focused on a revenue-impacting KPI.
- Test a new visualization or AI-based prediction layer.
Week 4: Measure & Scale
- Share insights across teams to align on learnings.
- Use performance data to adjust strategies or goals.
- Roll out improved reporting and enablement based on what worked.
Explore how accurate B2B data and insights from Salesgenie® can help improve your sales KPIs. Try us for free.
FAQs
Key KPIs for B2B sales include quota attainment, win rate, pipeline coverage ratio, and sales velocity. These metrics show how well your team is meeting goals, closing deals, and maintaining a healthy pipeline. As you scale, Net Revenue Retention (NRR) and Customer Lifetime Value (CLV) become vital for tracking long-term growth.
Sales velocity shows how quickly revenue flows through your pipeline. The formula is: number of opportunities multiplied by average deal size and win rate, divided by the length of your sales cycle. For example, if you have 50 opportunities at $10,000 each, a 20% win rate, and a 30-day sales cycle, your velocity would be $3,333 per day.
To assess pipeline health, check your pipeline coverage ratio, lead-to-opportunity conversion rate, and how deals move through each stage. If your coverage is well below target (typically three times your quota) or conversion rates drop at certain stages, it may be time to reevaluate lead quality or your sales process.
Top teams review KPIs weekly at the rep level to catch issues early, and monthly or quarterly at the leadership level for strategic planning. Weekly reviews help catch performance issues early, while longer-term reviews support strategic planning and forecasting.
The best tools combine CRM, analytics, and forecasting. Salesforce and HubSpot handle core tracking, while Tableau, Power BI, or Looker support advanced dashboards. AI tools like Gong and Clari enhance forecasts and coach reps using real-time data.